Customer Health Signals and Weekly Review
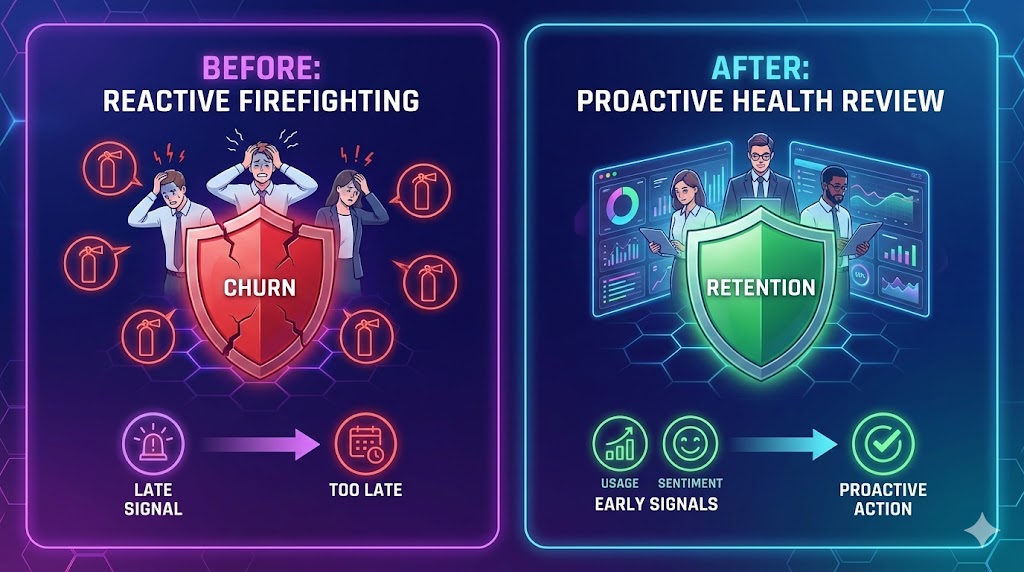
Pick three simple customer health signals (usage, money, friction) and review them weekly so you can prevent churn and trigger expansion early.
📌 Summary
Outcome: You spot customer risk and expansion opportunities early—before it shows up in churn or complaints.
Time: 45 minutes setup, then 15 minutes/week.
Owner: Customer owner (CS/Success/Support) or Founder.
Steps: Pick 3 signals → define thresholds → review weekly for your top segment → take 1–3 actions.
Metrics: Retention, repeat purchase/renewal rate, expansion rate, support load trends.
🎯 What you’ll achieve (in 2 weeks)
A simple “customer heartbeat” you can check weekly.
Early warnings for unhappy or inactive customers.
A short list of customers to save, activate, or expand—every week.
⏱️ Time & effort
Setup: 45 minutes
Ongoing: 15 minutes/week
Owner: CS/Support owner or Founder
Dependencies: Basic data from your product, payments, or support channel (even manual is fine)
🚦 When to use this (signals)
Use this quick win if:
You only notice problems when customers complain or cancel.
Support feels reactive and chaotic.
You can’t answer “Who is at risk?” or “Who is ready to expand?”
You have no weekly view of customer health—only monthly revenue reports.
🧩 Step-by-step (follow in order)
Step 1) Choose your “top segment” (don’t boil the ocean)
Start with one segment you care about most:
highest revenue customers
highest volume customers
newest customers (first 30–60 days)
customers in one plan/product line
Rule: Your first weekly review should cover 20–50 customers max.
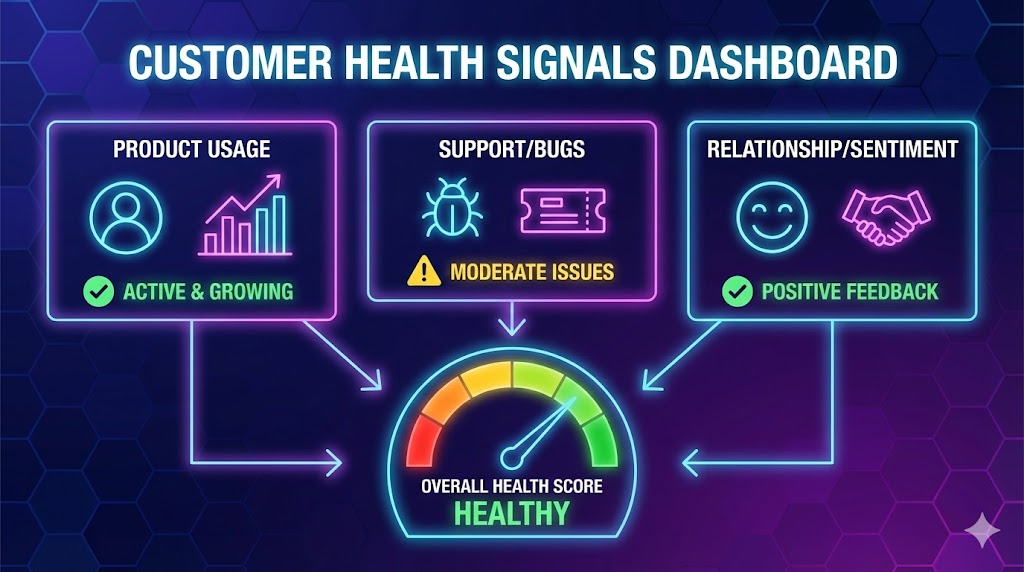
Step 2) Pick 3 signals that indicate value (keep it simple)
Choose one from each category:
Usage / engagement (are they using it?)
Money / repeat behavior (are they paying again / renewing?)
Friction / support (are they struggling?)
You’ll use these three signals to decide: save, activate, or expand.
Step 3) Define a simple threshold for each signal
Examples of thresholds:
“No usage in 14 days”
“No repeat purchase in 45 days”
“More than 3 tickets in 7 days”
“Invoice overdue by 14 days”
Rule: Make thresholds easy to measure. “Feels unhappy” doesn’t count.
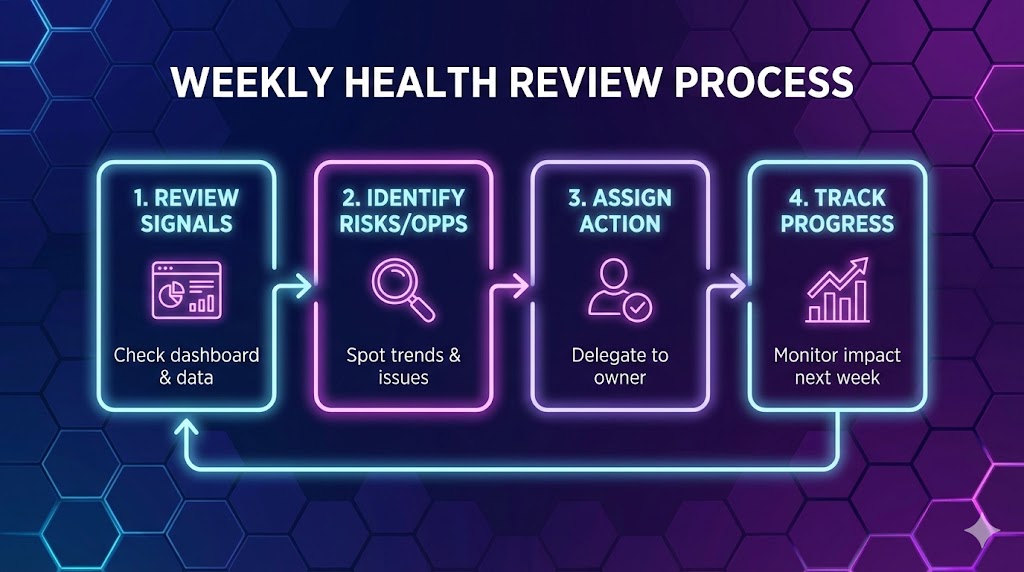
Step 4) Review weekly (15 minutes) and create 3 lists
Every week, for your top segment, produce:
At risk (needs save action)
Needs activation (needs guidance/value moment)
Expansion candidates (high value, low friction)
Step 5) Take 1–3 actions (don’t just “monitor”)
Pick small actions you can execute immediately:
At risk actions
10-minute check-in message + one concrete fix
offer a short “reset” call
escalate a specific issue to product/ops
Activation actions
send a 2-step “next best action” guide
invite them to one key feature/workflow
share one relevant example/template
Expansion actions
ask about a next use case
offer an add-on / upgrade path
request a referral or review after value is confirmed
✅ Done Definition (DoD)
You’re “done” when:
You selected one customer segment (20–50 customers)
You defined 3 health signals (usage + money + friction)
Each signal has a threshold
A weekly 15-minute review is on the calendar
Each review ends with a short action list
⚠️ Common mistakes (avoid these)
Mistake: Tracking 12 metrics → Do this instead: pick 3 signals only.
Mistake: Reviewing all customers → Do this instead: start with one top segment.
Mistake: No thresholds → Do this instead: define simple “red flag” cutoffs.
Mistake: Monitoring without actions → Do this instead: create the 3 lists + do 1–3 actions weekly.
Mistake: Mixing lagging metrics only (revenue) → Do this instead: include at least one leading indicator (usage or tickets).
📈 How to know it’s working (in 2 weeks)
You can name your top “at-risk” customers and why.
You proactively reach out before churn events.
Fewer “surprise” cancellations or angry escalations.
More expansion conversations triggered by real signals.
❓ FAQ
What if we don’t have product analytics?
Start manual. Use the simplest proxies: last login, last order date, invoices overdue, ticket count. You can upgrade later.
Should health scores be a single number?
Not at first. A single score hides nuance. Start with 3 signals + thresholds, then consider a score later.
What if our business is not subscription?
Use repeat behavior (repeat purchase, reorder frequency, repeat booking) instead of renewals.
How often should we review?
Weekly is ideal. Monthly is too slow—you’ll miss early warnings.
🎧 Example signal sets (choose one)
B2B SaaS
Usage: “No login / key action in 14 days”
Money: “Renewal within 60 days” (or “Invoice overdue 14 days”)
Friction: “>3 tickets in 7 days” or “same issue repeats”
Ecommerce
Engagement: “No reorder within expected cycle (e.g., 45–60 days)”
Money: “Refund/return rate above X%”
Friction: “Shipping/support tickets >2 per order”
Services (consulting, agencies, clinics)
Engagement: “No meeting / no deliverable progress in 14 days”
Money: “Invoice overdue 14 days” or “retainer renewal date within 30 days”
Friction: “Scope creep signals: >3 change requests in a week”
🔗 Related quick wins
⚙️ Want this to run automatically?
You can do this manually with a spreadsheet and a weekly review. If you’re using Super, you can track customer signals (usage, payments, tickets), segment customers, and generate a weekly “at risk / activate / expand” list in one place.